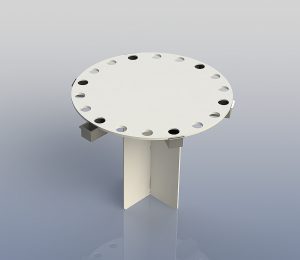
Product Photos
The Barnes maze is a tool used in psychological laboratory experiments primarily to measure spatial learning and memory. The basic function of Barnes maze is to measure the ability of a subject animal to learn and remember the location of a target zone using a configuration of distal visual cues located around the testing area. The Barnes Maze consists of a circular table-like surface with a number of circular holes located around its circumference. Typically, the goal is for the animal to reach a box positioned beneath one of the holes with the aid of visual cues that surround the Barnes Maze. Motivation, such as a food reward placed in the goal box is often used to help train the subject animal. In some experiments, the surface of the table is brightly lit. This serves as an aversive stimulus that motivates the subject animal to find (and perhaps hide in) the goal box.
The Barnes Maze is often used to study spatial memory and learning, evaluate drugs and other chemicals for their effect on the animal’s cognition, study cognitive aspects of transgenic animals having genetic strains modeling diseases such as Parkinson’s Disease, study the effects of traumatic brain injury on cognition and study searching strategies.
Kinder Scientific’s Barnes Maze combines quality and robust construction with our MotorMonitor™ software, common to all Kinder Scientific motor activity products, with our industry-leading post analysis routines for greater flexibility in analyzing data.
The MotorMonitor software also gives you the following Kinder Scientific Exclusive optional Advanced Graphic Comparator features!!
- HotSpots™
Acquire instant, graphical comparisons of session results! You no longer need to make assumptions with zone maps! View where animals spend their time, automatically! After you have viewed the HotSpots, you can create a zone map based on actual activity. You can display data from a single enclosure or from an enclosure ensemble, allowing you to visually compare animals or groups. The chart below shows the group analysis of many animals (15 in this case) where the closed arms are horizontal and the open arms are vertical.
“Blue” shows where the animals spent little time and red shows where the animals spent a lot of time. Activity concentrations which fall between the two extremes follow the color spectrum between red HotSpots™ and blue. Instead of just showing “open arm” or “closed arm” time, the Advanced Graphic Comparator shows EXACTLY where the animals spend their time during your experiment! This option is an extremely powerful aid in analyzing activity behavior! This feature is an excellent visual tool because you can open multiple windows to compare groups.
- Playback™:
View the path of an animal from a data document; speed it up if desired. You can overlay a compatible zone map and see activity relative to the areas of interest and set the time-sliding time clocks to view only the period of interest. You can also trace the entire path of the animal and print the results.
- OverTime™:
This option allows you to view the changes in activity Over Time. The chart zone metrics (Total Time, Rest Time, Distance, etc.) allow you to view these changes for multiple zones. Seeing how an animal or an ensemble of animals change as time changes allows for establishing baseline expectations as well as displaying a view of the changes that a drug causes over time. Below you can see an example of the classic Periphery versus Center zone analysis. Creating these views is very simple with a minimum of parameters to set.
Although the RADIAL ARM MAZE is primarily used to study spatial learning and memory in rats and mice, it is also used to study motor activity, cognition and reproduction/reproductive issues! It is truly a versatile research tool!
- Physical characteristics:
Rat model: 48.0” (121.92 cm) table diameter by 38.38″ (97.49 cm) high by 24.0” (60.96 cm) base diameter with 3.25” (8.26 cm) hole diameter and 8.06” (20.47 cm) food tray length and 3.63” (9.22 cm) food tray depth - Mouse model: 36.0” (91.44 cm) table diameter by 38.25″ (97.16 cm) high by 24.0” (60.96 cm) base diameter with 2.0” (5.08 cm) hole diameter and 7.70” (19.56 cm) food tray length and 2.31” (5.87 cm) food tray depth


