
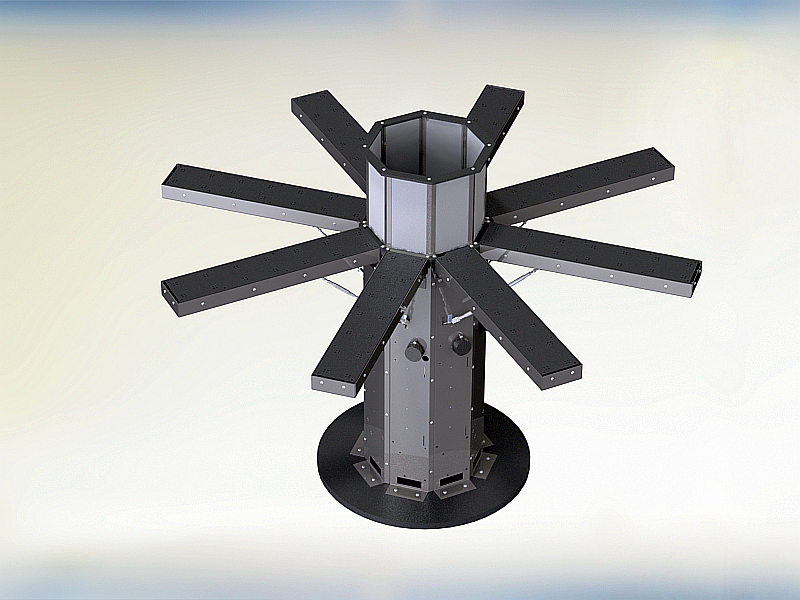
Radial Arm Maze with Arms Open
(Click to Enlarge)
Radial Arm Maze with Arms Open
(Click to Enlarge)
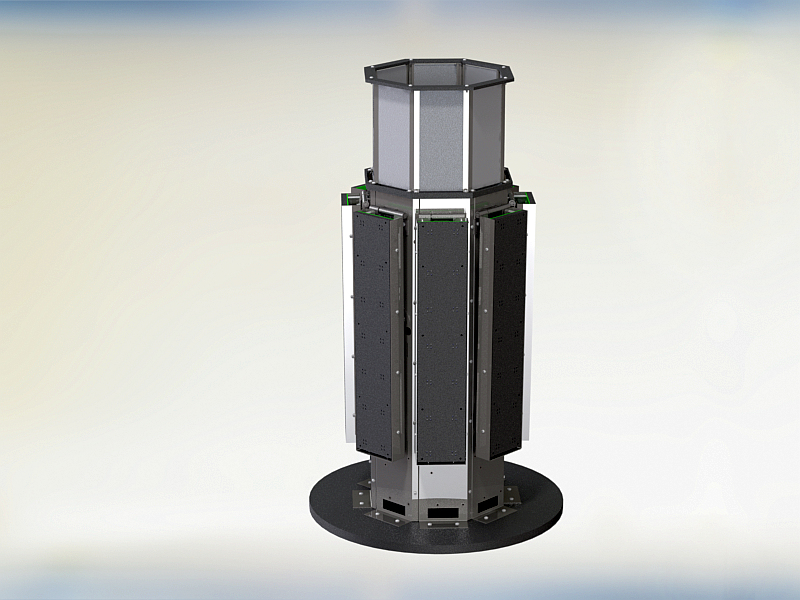
Radial Arm Maze with Arms Collapsed
(Click to Enlarge)
Kinder Scientific introduced the industry’s first collapsible RADIAL ARM MAZE!! Our RADIAL ARM MAZE has eight arms arranged around a small circular central platform. The end of each arm has a food site. Each arm has a door to allow or restrict access from the central platform to the respective arm. Each door is controllable by Kinder Scientific’s MotorMonitor™ software to allow you complete control over each door’s actuation and the ability to track the animal’s movements on the RADIAL ARM MAZE. Our RADIAL ARM MAZE also introduced the industry’s first through-the-floor gates! When the gates are all down, the animal has an unobstructed view of the entire room!
A fully deployed RADIAL ARM MAZE takes up a lot of space! When your RADIAL ARM MAZE is not in use, our unique design allows you to collapse all of the arms so that the RADIAL ARM MAZE assumes a small footprint! This saves you valuable lab and storage space!!
The MotorMonitor software also gives you the following Kinder Scientific Exclusive optional Advanced Graphic Comparator features!!
Kinder Scientific’s HotSpots software is a graphical gradient display! Acquire instant, graphical comparisons of session results! You no longer need to make assumptions with zone maps! View where animals spend their time, automatically! After you have viewed the HotSpots, you can create a zone map based on actual activity. You can display data from a single enclosure or from an enclosure ensemble, allowing you to visually compare animals or groups. The chart below shows the group analysis of many animals (15 in this case) where the closed arms are horizontal and the open arms are vertical.
“Blue” shows where the animals spent little time and red shows where the animals spent a lot of time. Activity concentrations which fall between the two extremes follow the color spectrum between red HotSpots™ and blue. Instead of just showing “arm” or “central platform” time, the Advanced Graphic Comparator shows EXACTLY where the animals spend their time during your experiment! This option is an extremely powerful aid in analyzing activity behavior! This feature is an excellent visual tool because you can open multiple windows to compare groups.
View the path of an animal from a data document; speed it up if desired. You can overlay a compatible zone map and see activity relative to the areas of interest and set the time-sliding time clocks to view only the period of interest. You can also trace the entire path of the animal and print the results.
This option allows you to view the changes in activity Over Time. The chart zone metrics (Total Time, Rest Time, Distance, etc.) allow you to view these changes for multiple zones. Seeing how an animal or an ensemble of animals change as time changes allows for establishing baseline expectations as well as displaying a view of the changes that a drug causes over time. Below you can see an example of the classic Periphery versus Center zone analysis. Creating these views is very simple with a minimum of parameters to set.
Although the RADIAL ARM MAZE is primarily used to study spatial learning and memory in rats and mice, it is also used to study motor activity, cognition and reproduction/reproductive issues! It is truly a versatile research tool!